Tech Tips
How To Create A Jet Chart
Working the front office at SwedeTech, I receive a lot of phone calls and emails from many individuals. Some own our engines, some own a SwedeTech accessory, and some just want technical help.
One of the most common questions I receive is, “Can you send me a jet chart?”
My first response is, “Do you own a SwedeTech engine?”
I will ask the customer about the specifications on the engine. TM, Maxter, Pavesi, CR125, Modified CR125 or Stock CR125. Blah, blah, blah.
It is very hard for us to supply a generic jet chart without knowing specifics from our customer. A jet chart is not absolute, it offers a baseline to assist in tuning. There is no magic jetting that we can just guess at over the phone.
If your kart is not equipped with a data acquisition system with the minimum of R.P.M.’s and temperature, stop reading now and buy a unit. The MyChron 4 is widely used in karting and is one suggestion. Without the data acquisition unit, you have no idea what your engine is doing. For the purpose of this article, you will also need a weather station or equipment to calculate Corrected Density Altitude. For years, SwedeTech has used the Computech Race Air 3000.
Density altitude is a value in feet that relates the local measured atmospheric conditions (absolute barometric pressure or pressure altitude, temperature, and relative humidity) to the aeronautical industry defined standard day atmosphere. The density altitude for an absolute barometric pressure of 29.92 In. Hg. or a pressure altitude of 0 ft., a temperature of 60°F, and a humidity of 0% is 0 ft. A good air day in the spring or fall might be below 0 ft. (i.e. –831 ft.). Conversely, a hot summer day might have a density altitude of 4500 ft. (equivalent to 4500 ft. of altitude on a standard day). **
Why is density altitude important?
The atmospheric conditions that make air quality better for racing are: lower temperature, lower humidity, and higher air pressure. Conditions that make the air worse for racing purposes are: higher temperature, higher humidity, and lower air pressure. Lower Correction Factor numbers, lower Density Altitude numbers and higher Air Density Ratio numbers all mean better air quality. The variables that cause the Correction Factor numbers and the Density Altitude numbers to decrease (smaller numerically), as well as the Air Density Ratio numbers to increase (larger numerically), are: a lower temperature, a lower relative humidity, a higher barometric pressure (as measured with a barometer), or a lower pressure altitude (as measured with an altimeter). **
Typically the Correction Factor will be between .98 (better) and 1.15 (worse); the Density Altitude will be between -300 ft. (better) and 8,000 ft. (worse); the Air Density Ratio will be between 85% (worse) and 103% (better). Remember, as the Correction Factor and the Density Altitude increase (larger numerically), performance will decrease resulting in slower elapsed times. As the Correction Factor and Density Altitude decrease (smaller numerically), performance will increase causing faster elapsed times. The lower the Air Density Ratio (smaller numerically), the leaner your jetting needs to be and the higher the Air Density Ratio (larger numerically), the richer your jetting needs to be. **
So by this point, you should understand that you need data acquisition and basic instruments to measure the air. Other items that will factor in to your jetting calculations and jet chart will include:
Brand of fuel and octane rating
Brand of two-stroke oil and oil ratio
Gear ratio used for each track (rear sprocket teeth count divided by the front sprocket teeth)
Tire compounds
Grip level of the racing surface/chassis setup
Driver’s ability
Engine Setup (reeds, exhaust pipe, silencer, porting, head volume, etc)
Fuel System set up (GFS, Pump Around, or other methods)
All of the above items factor into jetting and creating an accurate chart. A general rule of thumb, the larger the load on the engine, the more fuel you will need. If you are driving a track that requires a 1.50 gear ratio compared to a track with a 1.35 gear ratio, all else being equal, the 1.35 gear ratio will require more fuel for optimum engine performance.
If you change any of the above items, you will have to adjust your jet chart. One of the largest overlooked areas is fuel. Just because one fuel has an octane rating of 98 octane and the other one is rated at 100, it doesn’t mean the fuels are similar or interchangeable.
This point was driven home for me a couple of years ago with a group of our road racing customers. I suggested that our customers used Brand A’s 98 octane fuel. They decided it was too hard to find the Brand A fuel and had chosen to use the tracks supplied fuel that had a 100 octane rating. A number of those same customers called me on Monday to express their dissatisfaction with their stuck engines.
Upon inspection, all the engines seized due to lean conditions. All of the engines had one common denominator, the track fuel was used.
Now back to the topic of creating your own jet chart. I have uploaded two spreadsheet files for your use as a template. They can be accessed with these links:
https://docs.google.com/spreadsheet/ccc?key=0AjAt3goXdH34dFRiWERHVjk2eXdNZGtXQWxldExkNlE — Blank Template
https://docs.google.com/spreadsheet/ccc?key=0AjAt3goXdH34dHM2RzF2TjZ1eURqajlCSGVJM2dweWc — Stock Moto Jet Chart
*** Please Note - The Above Honda CR125 Stock Moto Jet Chart is for example only. It may not be the proper jetting for your specific engine package. ***
I would recommend printing a number of copies so you can write notes and make changes as necessary. This will take some time on your part with track testing, properly tuning your engine, and reading the air and recording the data every single session. Before you begin your track session, record the temperature, humidity, and density altitude. When you come off the track, record the same figures. The more often you do this, the better your jet chart will become. Now record your notes on how the engine performed. Record your notes on the carburetor jetting.
Was the engine running rich, just right, or too lean?
Record your tuning notes and make the appropriate changes and put your ass back in the seat and drive. Now repeat this process over the next few months every time you take to the track. Very quickly you will see a pattern develop. You will see that your notes and your jet chart will work together to help make you faster on the track.
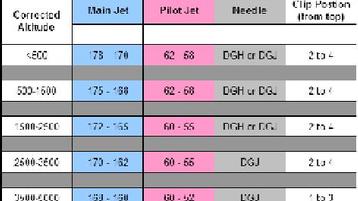
On the left side of the chart, we have the Corrected Altitude column. We have broken down each segment into approximately 1000 ft increments. You can change these values as you see fit. From our experience, we have found that an engine will require a jet change when the Density Altitude changes 200 – 400 feet. In the main jet and pilot jet columns, you will notice the jets numbers will go smaller as the Corrected Altitude numbers increase. As the corrected density altitude increases, you will need to decrease your fuel supply. Again, this is only if all other items remain constant, which they don’t, because this is racing.
I have seen some very creative jet charts. The sample I have provided is very simple. It is used to give you a baseline. If you chose to have more data on your chart, you can create different charts for different gear ratios.
We offer our engine customers jet charts for sprint racing as well as road racing. I always recommend that our customers record their data and adapt the jet charts as suited for their needs.
Credits –
** Content provided with permission from Computech